Air Quality
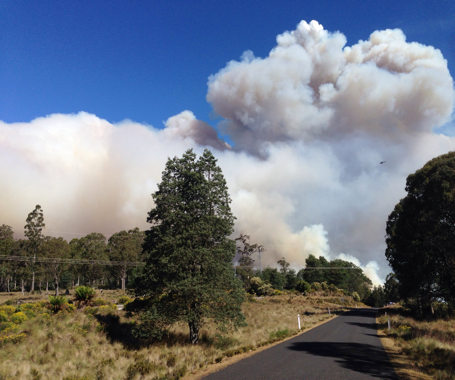
Poor air quality happens for many reasons. Bushfires, planned burns and wood heaters are major sources of air pollution in many parts of Australia, and this type of pollution is called 'particulate matter’ or PM.
Increases in the concentration of PM can trigger conditions like asthma and make other lung and heart conditions worse. In large populations, increased PM is linked to increases in ambulance call outs, hospital admissions and deaths.
The specific type of air pollution reported by AirRater is known as PM2.5. These are very small particles with a diameter of 2.5 micro-metres or less (0.0025mm). Particles can also be measured as PM10, which are particles with a diameter of up to 10 micro-metres (0.01mm). For comparison, a human hair is 50-70 micrometres, or 0.05-0.07mm in diameter. You can’t see a single PM2.5 particle with your naked eye, but when there are many particles in the air, it will appear hazy.
AirRater provides location-specific reports of PM2.5, drawing this information from air quality monitoring networks in all states and territories. These networks update air quality information in near real-time (10 minutes to one hour).
In areas more than 20 km from a monitoring station, AirRater uses an estimate from an atmospheric model of air pollution (like a weather model). These estimates will be less precise than those drawn directly from the monitors.
For more information about air quality measurements in AirRater, see our Air Quality explainer.
Temperature
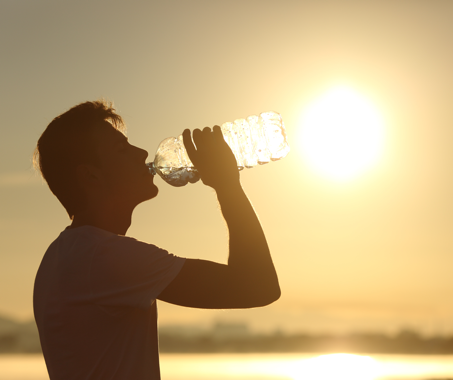
Extremes of temperature, both hot and cold, can be a health hazard for many people. Extreme heat is linked to illness and death, particularly for vulnerable people such as the elderly, the very young and those with existing health conditions like diabetes and heart disease. Extremes of cold, or sudden drops in temperature, are also linked with increases in asthma.
All Australian states have both cold and hot spells, and these often happen quickly and with little warning. The AirRater app uses the same methodology as the Australian Bureau of Meteorology’s Heatwave Service to determine when, where and how severe a forecast heatwave will be. Notifications will be sent to you in the heatwave affected area, giving prior warning of the conditions and allowing preparations to be made to cope with the heatwave. Similarly, a forecast extreme cold spell will be notified to you in the affected area.
Research has shown that Australia is likely to see an increased number of warmer days and an increased number of heatwaves into the future. For more information on preparing for and coping with heatwaves, visit the Bureau of Meteorology’s Heatwave Service website, and go to the ‘Useful Links’ section for heatwave information for your region.
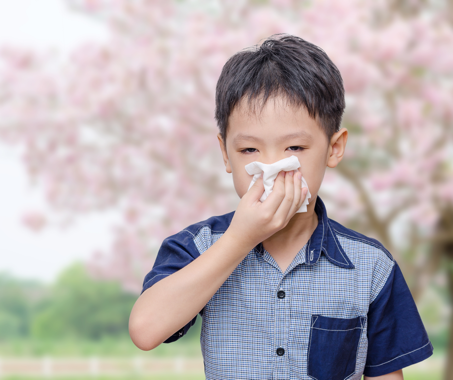
Pollen
Pollen count is measured at select sites across Australia. The monitors work by capturing pollen on a sticky surface, which is then 'read' under a microscope. This involves identifying the pollen grains on the slide, and counting the number of each species. AirRater's pollen labs can identify over 25 different species, with the most common allergenic types listed in the app.
We have pollen count monitors in the following locations which feed directly into the AirRater app:
- Tasmania (at Sandy Bay and Launceston)
- the ACT (at the Australian National University)
- NSW via Sydney Pollen (at Campbelltown)
We also have monitors collecting long-term pollen count samples at:
- Devonport and Campbell Town in Tasmania
- and in Darwin in the Northern Territory
At these sites, we don't have pollen counting staff, so aren't able to collect data from these monitors every day. However, we collect weekly samples, and these are sent to our Hobart lab for later analysis. We use this information to help us work towards better pollen forecasting models.